
Flow Path
A Sankey-style visualization of how patients move through a care flow, showing where they engage and where they drop off.
Flow Path shows how patients progress through a care flow as a Sankey-style diagram: each band is a group of patients, and the band splits wherever they take different routes. It answers the question behind "is this care flow working" by showing where patients drop off.
Open Flow Path and set the version and date range
Go to Improve → Flow Path and select a care flow, then set the version and the date range:
- Version. The latest published version shows by default, and another version can be selected.
- Date range. Last 30 days by default, with other presets and a custom range.
Numbers for this month say very little about a version that changed mid-month.
Width shows patient volume, red shows drop-off
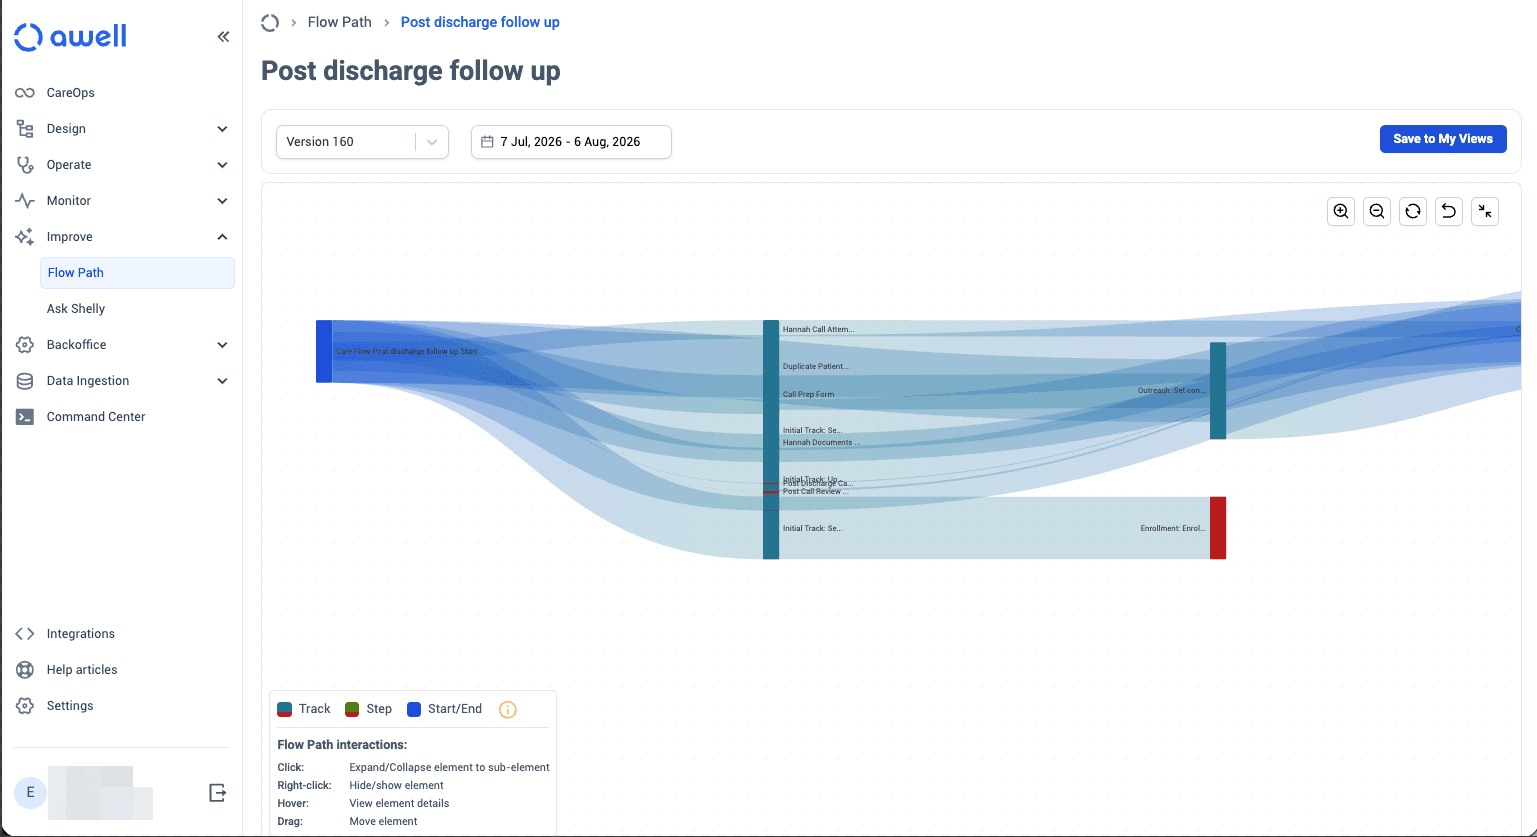
The diagram shows patients moving through connected elements:
- Tracks appear as turquoise rectangles.
- Steps appear as green rectangles when a track is expanded.
- Red portions mark patients who did not continue.
A diagram that narrows sharply at one step marks where patients are being lost.
Investigate a sharp drop before anything else
Common causes:
- The step asks too much at once. See Add conditions to your questions to shorten what each person sees.
- Patients never received it. Check Configure webhooks in Studio or the email configuration.
- A system activity is making them wait. See Care flow design with Hosted Pages.
Next steps
Next: Ask Shelly to put numbers on what the diagram suggests.